Table of Contents
More than 60% of companies say that generating organic traffic and leads is a major marketing challenge. For many, the answer to that problem is search engine optimization (SEO).
The practice of improving a web page so it appears higher in search engine results, SEO has proven itself as arguably the most valuable marketing tactic for driving long-term, sustainable business growth online.
But don’t take our word for it. These 90+ SEO statistics make the case that every business, no matter its size, should be using SEO to boost KPIs at every stage of the funnel. Use these SEO stats to inform yourself about the tactic, compare and contrast, or justify SEO as a must-have in your marketing strategy.
SEO ROI statistics
- 40% of online revenue comes from organic search activity.
- SEO provides 1000%+ more web traffic than social media platforms.
- The top-ranking post on the first page of Google search results earns 19.3% of all clicks.
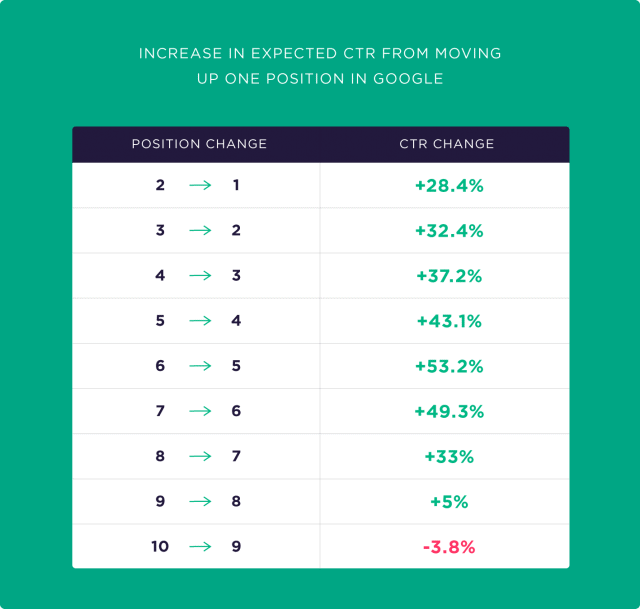
- Improving your page’s ranking by just one spot can improve its click-through rate by up to 30.8%.
- Using an inbound marketing approach can generate leaders that cost 61% less than leads generate through outbound marketing tactics.
- Having a blog on your website can increase your monthly lead generation by 67%.
SEO industry statistics
- 64% of marketers spend time implementing SEO techniques.
- SEO agencies charge a per-project fee which is three times more than the average fee charged by freelancers.
- SEOs who know how to code earn 7.3% more annually than those who don’t.
- 88% of hourly SEO professionals charge $150/hour or less.
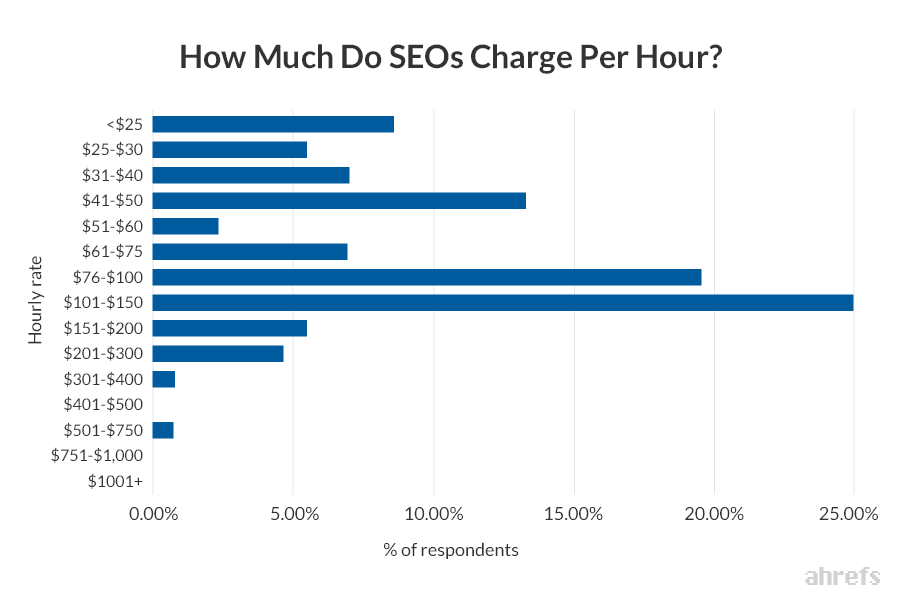
- 25% of SEOs charge between $501 and $1000 for standalone projects.
- On average, SEO professionals make $60,548 per year according to data compiled from Glassdoor.
B2C/B2B SEO statistics
- 51% of all B2C/B2B web traffic comes from organic search results.
- Of American shoppers who visited a store within the last week, 83% searched for a product or service online before making the trip.
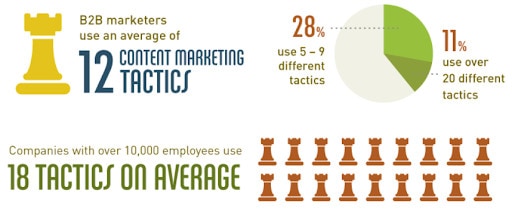
- The average B2B digital marketing strategy uses 12 separate tactics.
- 53% of consumers say that content images motivate them to purchase products or services.
- 91% of B2B marketers use content creation and marketing in their outreach strategy.
Search engine statistics
- Google processes more than 3.5 billion searches per day and more than 1.2 trillion searches per year.
- 80% of consumers use a search engine to find a product or service.
- 75% of users never navigate past the first SERP.
- Users decide in the first 10-20 seconds of viewing a web page whether it has value.
- Relevant search results impact 39% of consumers who want to buy a product/service online.
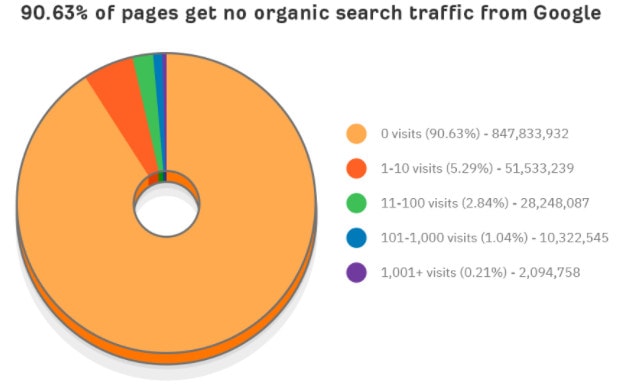
- 90.63% of all web pages receive zero organic traffic.
- A featured snippet as the first search result will receive 8.6% of clicks while the listing below it will get 19.6% of clicks.
- Of all mobile and desktop searches, 83% come from Google.
- 31.7% is the average click-through rate for top-ranking SERP listings.
- Bing accounts for more than 6% of all mobile and desktop searches.
- Featured snippets show up in SERPs for more than 12% of all search queries.
- 34.4% of mobile searches generate zero user clicks.
Mobile SEO statistics
- 93% of all mobile searches happen on Google.
- 65% of consumers report using a tablet to search the internet while watching television.
- The average user spends more than 3 hours per day on their smartphone or tablet.
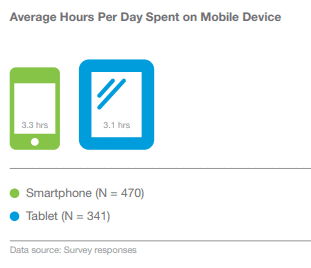
- 91% of consumers say that being able to access content from any type of device is important to them.
- 88% of local searches happen on mobile devices.
- 79% of the time that users spend online comes from mobile devices.
- 75% of smartphone users expect instant information when they perform a mobile search.
- Mobile website optimization is the #1 technical SEO tactic that marketers use to improve their site.
- 52% of global search traffic comes from mobile devices.
- In Asia, mobile searches account for 65% of web traffic.
- 51% of users find new websites and brands via search results on their smartphone.
- The first SERP listing for mobile searches earns 27.7% of all clicks.
Backlinks statistics
- Businesses that have blogs on their website earn 97% more backlinks than competitors who don’t.
- Link building is one of the top three ranking factors that the Google algorithm considers.
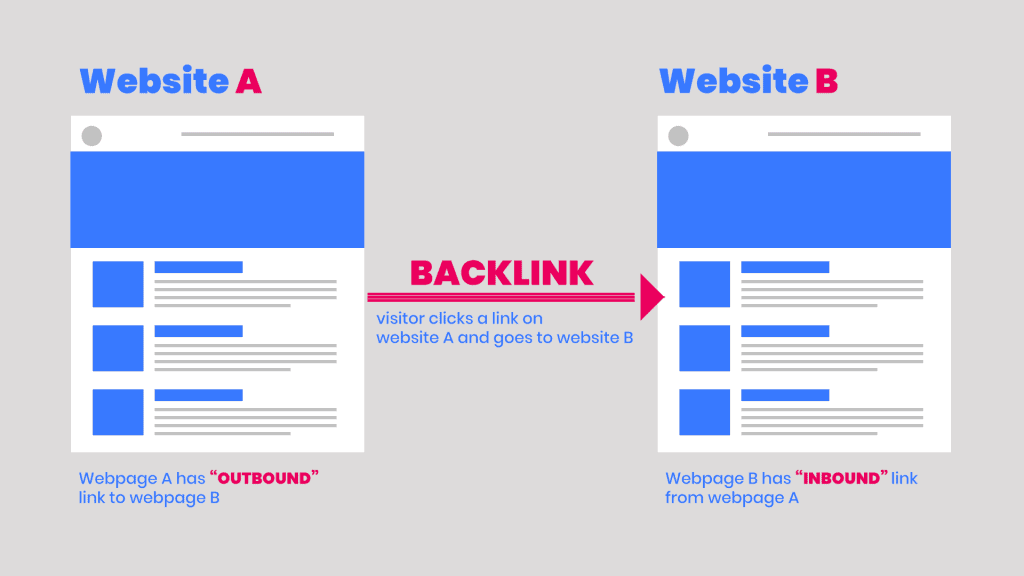
- Only 34% of web pages have backlinks in them.
- The top-ranking SERP listing receives 5% to 14.5% more backlinks than competing listings.
- On average, buying a backlink cost $361.44 in 2018.
- The average price of a guest blog post is $77.80.
Keyword statistics
- Adding a keyword to your URL can make its click-through rate 45% higher than if you included no keywords.
- Searches containing “Simple” + “ideas” on mobile devices have increased by more than 60% since 2018 (i.e. simple hairstyle ideas, simple planning ideas).
- Long-tail keywords have an average conversion rate of 36%.
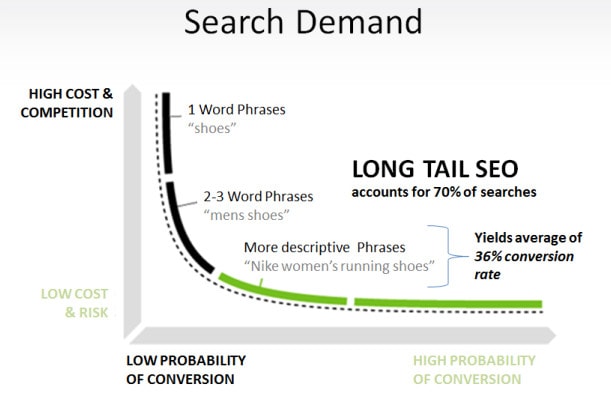
- The use of the keyword “personalized” has grown in mobile searches by 60% since 2018.
- From 2016 to 2018, mobile searches using the keyword “podcast” increased by 80%.
- Keywords “best” and “recipe” each account for 2.3% of all featured snippets generated in Google search results.
- 8% of users type their search terms in the form of a question.
Local SEO statistics
- Between 2017 and 2018, the amount of website clicks that came from Google My Business listings increased by 29%.
- In the years 2017-2019, mobile search queries for “store open near me” increased by more than 250% (i.e. bike shop open near me, nail salon open near me).
- 71% of consumers are willing to turn on location sharing so they can receive more accurate Google search results.
- Nearly a third (30%) of all mobile search queries include local keywords.
- Of users who make a mobile search for something nearby, 76% will visit a local business within a day.
- More than a quarter (28%) of all mobile searches for nearby products or services result in a purchase.
- For keywords containing a city and business category, 92% show a Yelp listing in the top five search results.
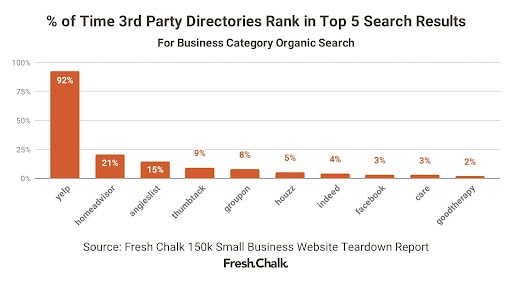
- Local searches lead to 2.5 times more purchases than non-local searches.
- Almost half (45%) of shoppers around the world use the internet to buy a purchase that they pick up in-store at a later time.
Voice SEO statistics
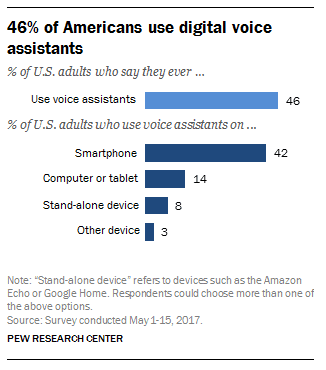
- 46% of Americans use digital voice assistants like Siri and Alexa on a regular basis.
- 92% of voice technology users say that the search method saves them time.
- Of users aged 18-49, 83% say they enjoy the hands-free component of digital voice search.
- 27% of internet searchers across the world use mobile voice search technology.
- Voice search results load 52% faster than average web pages.
- Standalone devices like Amazon Echo and Google Home are used by 8% of voice search technology users.
- The average Google Home voice search result has an Ahrefs Domain Rating of 76.8.
- More than 40% of voice search answers are the result of a featured snippet on the SERP.
YouTube SEO/Video SEO statistics
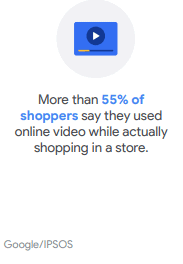
- While shopping in a physical store, more than 55% of consumers use video marketing materials to research purchases they are considering.
- On the first YouTube results page, 68.2% of the videos are in HD quality.
- From 2016-2018, watch time on shopping-related YouTube videos increased by 5 times.
- 70% of all YouTube video streaming happens on mobile devices.
- The primary type of media that is used as part of an SEO strategy is video (even above infographic or blogging).
- The top-ranking videos in YouTube search engine results are an average of 14 minutes, 50 seconds long.
- Every year, YouTube searches for “how to” increase by 70%.
SEO vs PPC statistics
- Of people who use ad blockers, 64% say it’s because ads are annoying and intrusive to the search experience.
- More than 25% of all internet searchers use an ad blocker.
- SEO has 20 times the traffic potential that PPC campaigns have within search engines.
- 75% of users state they would prefer less ads while searching.
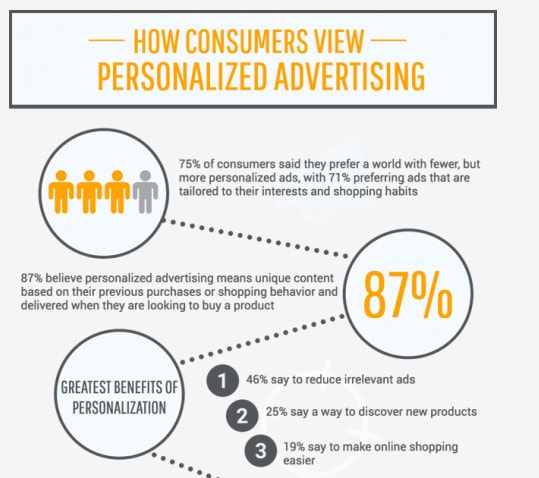
- 71% of users prefer personalized ads–ones that align with their shopping interests and habits.
- Your brand awareness can increase by 46% just by having a paid ad show up in mobile search results.
Page speed statistics
- Ecommerce sites making $100,000 per day can lose more than $2M in annual revenue for each second longer it takes their pages to load.
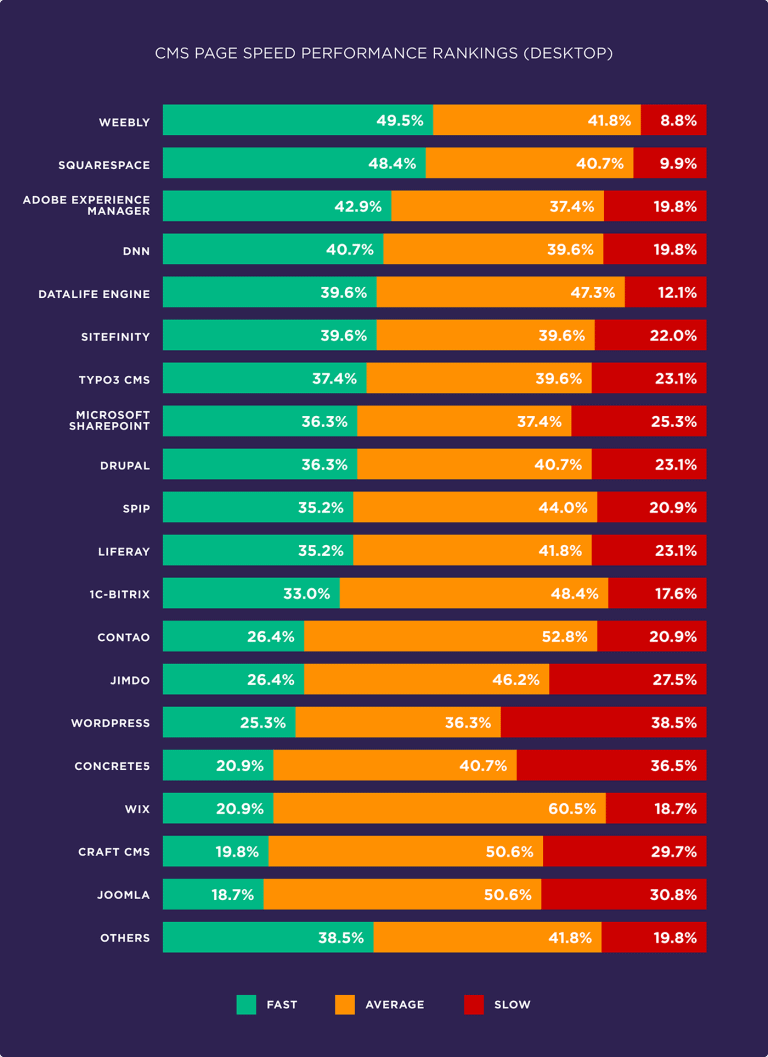
- WordPress, the most-used CMS on the internet, ranks 14th among competitors for mobile page speed results.
- 40% of users leave a site if it takes longer than three seconds to load.
- To improve their search rankings, the #1 approach that marketers use is page speed optimization.
- Almost half (47%) expect web pages to load in two seconds or less.
- Mobile sites take more than 87% longer to load than desktop versions.
Get a complimentary SEO audit
Guessing at the best way to generate traffic and leads will make it hard to focus your efforts on the highest-potential areas of your website. Instead, follow SEO stats and trends to find the best use of your time. They’ll inform your overall marketing strategy and give you a competitive advantage.
Want to see how you’re doing with SEO? Get an instant SEO audit below. Or, schedule a free consultation to see how intent SEO can boost search traffic revenue by 700%.
References
SEO ROI statistics
- https://www.brightedge.com/resources/research-reports/content-optimization
- https://www.seoclarity.net/mobile-desktop-ctr-study-11302/
- https://backlinko.com/google-ctr-stats
- https://www.demandmetric.com/content/content-marketing-infographic
- https://blog.hubspot.com/blog/tabid/6307/bid/31555/inbound-leads-cost-61-less-than-outbound-new-data.aspx
- https://videos.brightedge.com/research-report/BrightEdge_ChannelReport2019_FINAL.pdf
SEO industry statistics
- https://cdn2.hubspot.net/hubfs/53/tools/state-of-marketing/PDFs/Not%20Another%20State%20of%20Marketing%20Report%20-%20Web%20Version.pdf
- https://ahrefs.com/blog/seo-pricing/
- https://backlinko.com/seo-jobs-report
B2C/B2B SEO statistics
- https://www.brightedge.com/resources/research-reports/content-optimization
- https://storage.googleapis.com/think/docs/think-with-google-2019-research-review.pdf
- https://www.demandmetric.com/content/content-marketing-infographic
Search engine statistics
- https://www.netmarketshare.com/search-engine-market-share
- https://www.seoclarity.net/mobile-desktop-ctr-study-11302/
- https://ahrefs.com/blog/featured-snippets-study/
- https://www.internetlivestats.com/google-search-statistics/
- https://backlinko.com/google-ctr-stats
- https://www.thinkwithgoogle.com/consumer-insights/consumer-trends/meet-needs-i-want-to-buy-moments/
- https://ahrefs.com/blog/search-traffic-study/
- https://blog.hubspot.com/insiders/inbound-marketing-stats
- https://www.nngroup.com/articles/how-long-do-users-stay-on-web-pages/
Mobile SEO statistics
- https://www.netmarketshare.com/search-engine-market-share
- https://brandcdn.exacttarget.com/sites/exacttarget/files/deliverables/etmc-2014mobilebehaviorreport.pdf
- https://www.thinkwithgoogle.com/marketing-strategies/search/how-advertisers-can-extend-their-relevance-with-search-download/
- https://storage.googleapis.com/think/docs/think-with-google-2019-research-review.pdf
- https://cdn2.hubspot.net/hubfs/53/tools/state-of-marketing/PDFs/Not%20Another%20State%20of%20Marketing%20Report%20-%20Web%20Version.pdf
- https://www.statista.com/statistics/241462/global-mobile-phone-website-traffic-share/
- https://www.thinkwithgoogle.com/marketing-strategies/search/being-there-micromoments-especially-mobile/
- https://www.seoclarity.net/mobile-desktop-ctr-study-11302/
- https://sparktoro.com/blog/google-ctr-in-2018-paid-organic-no-click-searches/
- https://www.statista.com/statistics/266379/mobile-share-of-digital-minutes-countries/
Backlinks statistics
- https://ahrefs.com/blog/buy-backlinks/
- https://ahrefs.com/blog/search-traffic-study/
- https://ahrefs.com/blog/backlink-growth-study/
- https://www.youtube.com/watch?v=l8VnZCcl9J4&feature=emb_title
- https://sideping.com/online-marketing/what-are-backlinks-why-are-they-important-for-seo/
Keyword statistics
- https://storage.googleapis.com/think/docs/think-with-google-2019-research-review.pdf
- https://ahrefs.com/blog/featured-snippets-study/
- https://backlinko.com/google-ctr-stats
- https://moz.com/blog/state-of-searcher-behavior-revealed
- https://neilpatel.com/blog/long-tail-keywords-seo/
Local SEO statistics
- https://brandcdn.exacttarget.com/sites/exacttarget/files/deliverables/etmc-2014mobilebehaviorreport.pdf
- https://www.thinkwithgoogle.com/marketing-strategies/app-and-mobile/mobile-search-trends-consumers-to-stores/
- https://storage.googleapis.com/think/docs/think-with-google-2019-research-review.pdf
- https://freshchalk.com/blog/150k-small-business-website-teardown-2019
- https://www.thinkwithgoogle.com/marketing-strategies/search/how-advertisers-can-extend-their-relevance-with-search-download/
- https://www.brightlocal.com/research/google-my-business-insights-study/
Voice SEO statistics
- https://www.pewresearch.org/fact-tank/2017/12/12/nearly-half-of-americans-use-digital-voice-assistants-mostly-on-their-smartphones/
- https://storage.googleapis.com/think/docs/think-with-google-2019-research-review.pdf
- https://backlinko.com/voice-search-seo-study
- https://searchengineland.com/study-48-of-consumers-use-voice-assistants-for-general-web-search-319729
YouTube SEO/Video SEO statistics
- https://storage.googleapis.com/think/docs/think-with-google-2019-research-review.pdf
- https://cdn2.hubspot.net/hubfs/53/tools/state-of-marketing/PDFs/Not%20Another%20State%20of%20Marketing%20Report%20-%20Web%20Version.pdf
- https://backlinko.com/youtube-ranking-factors
SEO vs PPC statistics
- https://blog.hubspot.com/marketing/why-people-block-ads-and-what-it-means-for-marketers-and-advertisers
- https://www.businessinsider.com/30-of-all-internet-users-will-ad-block-by-2018-2017-3
- https://www.adlucent.com/blog/2016/71-of-consumers-prefer-personalized-ads
- https://www.thinkwithgoogle.com/marketing-strategies/search/being-there-micromoments-especially-mobile/
- https://sparktoro.com/blog/google-in-2020-from-everyones-search-engine-to-everyones-competitor/
Page speed statistics
- https://cdn2.hubspot.net/hubfs/53/tools/state-of-marketing/PDFs/Not%20Another%20State%20of%20Marketing%20Report%20-%20Web%20Version.pdf
- https://neilpatel.com/blog/loading-time/
- https://www.akamai.com/uk/en/about/news/press/2009-press/akamai-reveals-2-seconds-as-the-new-threshold-of-acceptability-for-ecommerce-web-page-response-times.jsp
- https://backlinko.com/page-speed-stats
