
Table of Contents
User experience is at the heart of search engine optimization, so why do so many websites fail to prioritize page speed? The average page speed for mobile devices is 27.3 seconds. But research has shown that nearly 25% of users aren’t willing to wait for more than 4 seconds.
Tracking page speed metrics can provide the foundation for optimization strategies that improve user experience. As you begin to improve your website speed, you’re likely to see improvements in sales, conversion rates, and overall site performance.
Why is page speed important?
Page speed is a major Google ranking factor because it directly impacts user experience. The Google algorithm will judge your content harshly if it doesn’t load quickly for users. And there are several reasons why.
The impact that page speed has on your bounce rate is evident:
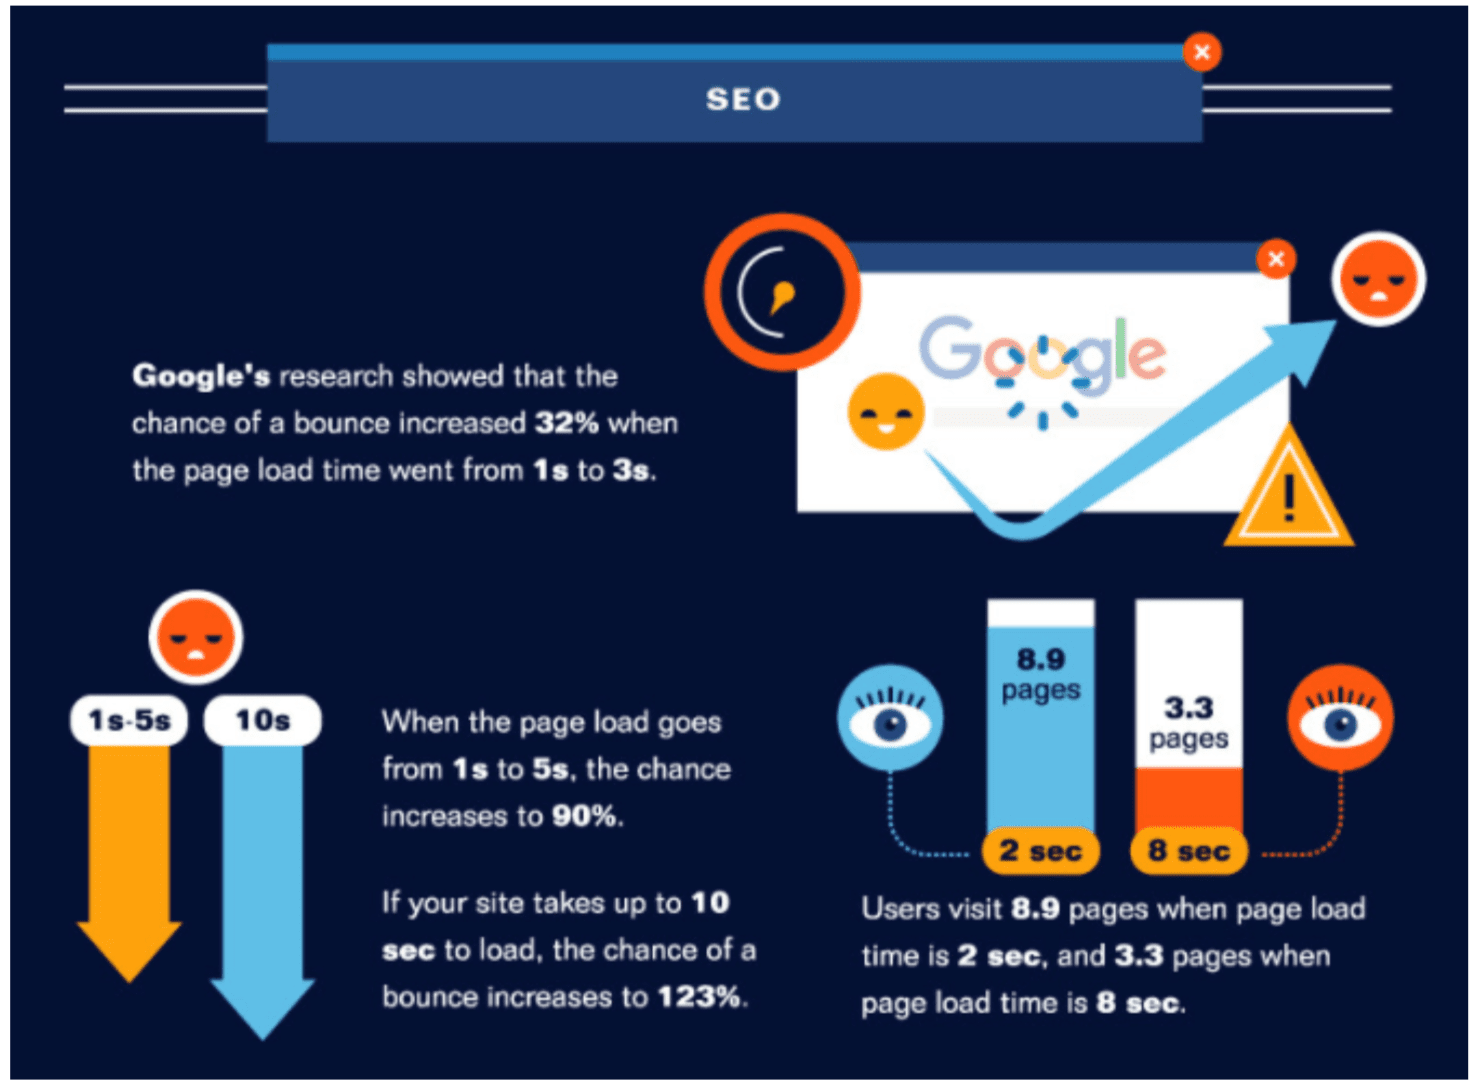
On average, users visit 5.6 fewer pages when the load time increases from 2 seconds to 3.3 seconds. And the likelihood of a user bouncing is all but guaranteed (123%) after the 10-second mark. These poor user experience metrics will drop your rankings if you don’t address them quickly.
Research shows that abandonment rates increase significantly the longer that it takes a page to load.
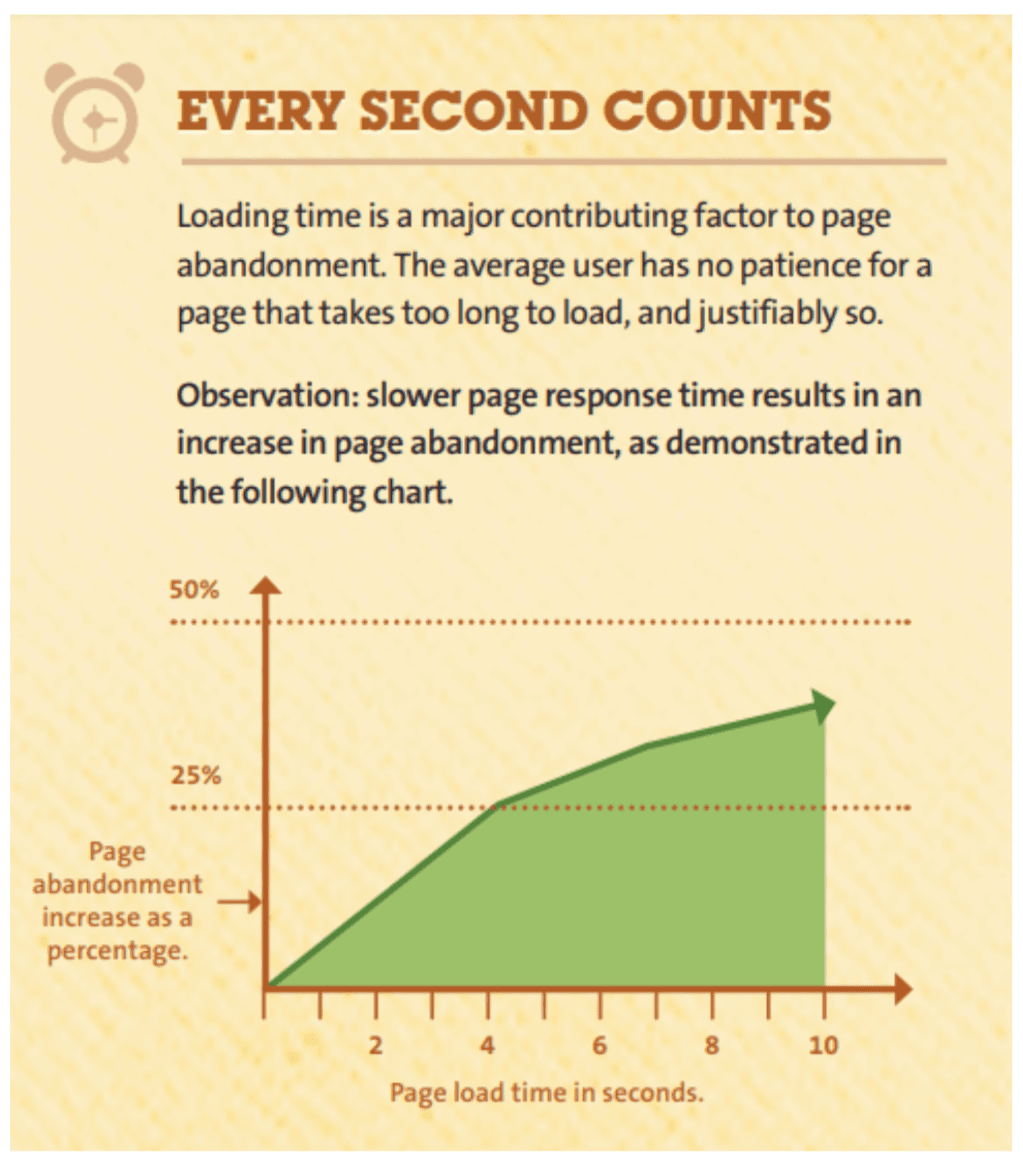
Unless they want to visit a specific website, users won’t wait around for a page to load. When browsing search engine results pages (SERPs), most users have no problem leaving a slow site to find information on a faster one.
And downstream, poor user experience can affect sales, conversions, and engagement. Even beyond that, a slow page can also create a negative lasting impression with the user, preventing them from ever returning to your marketing funnel again.
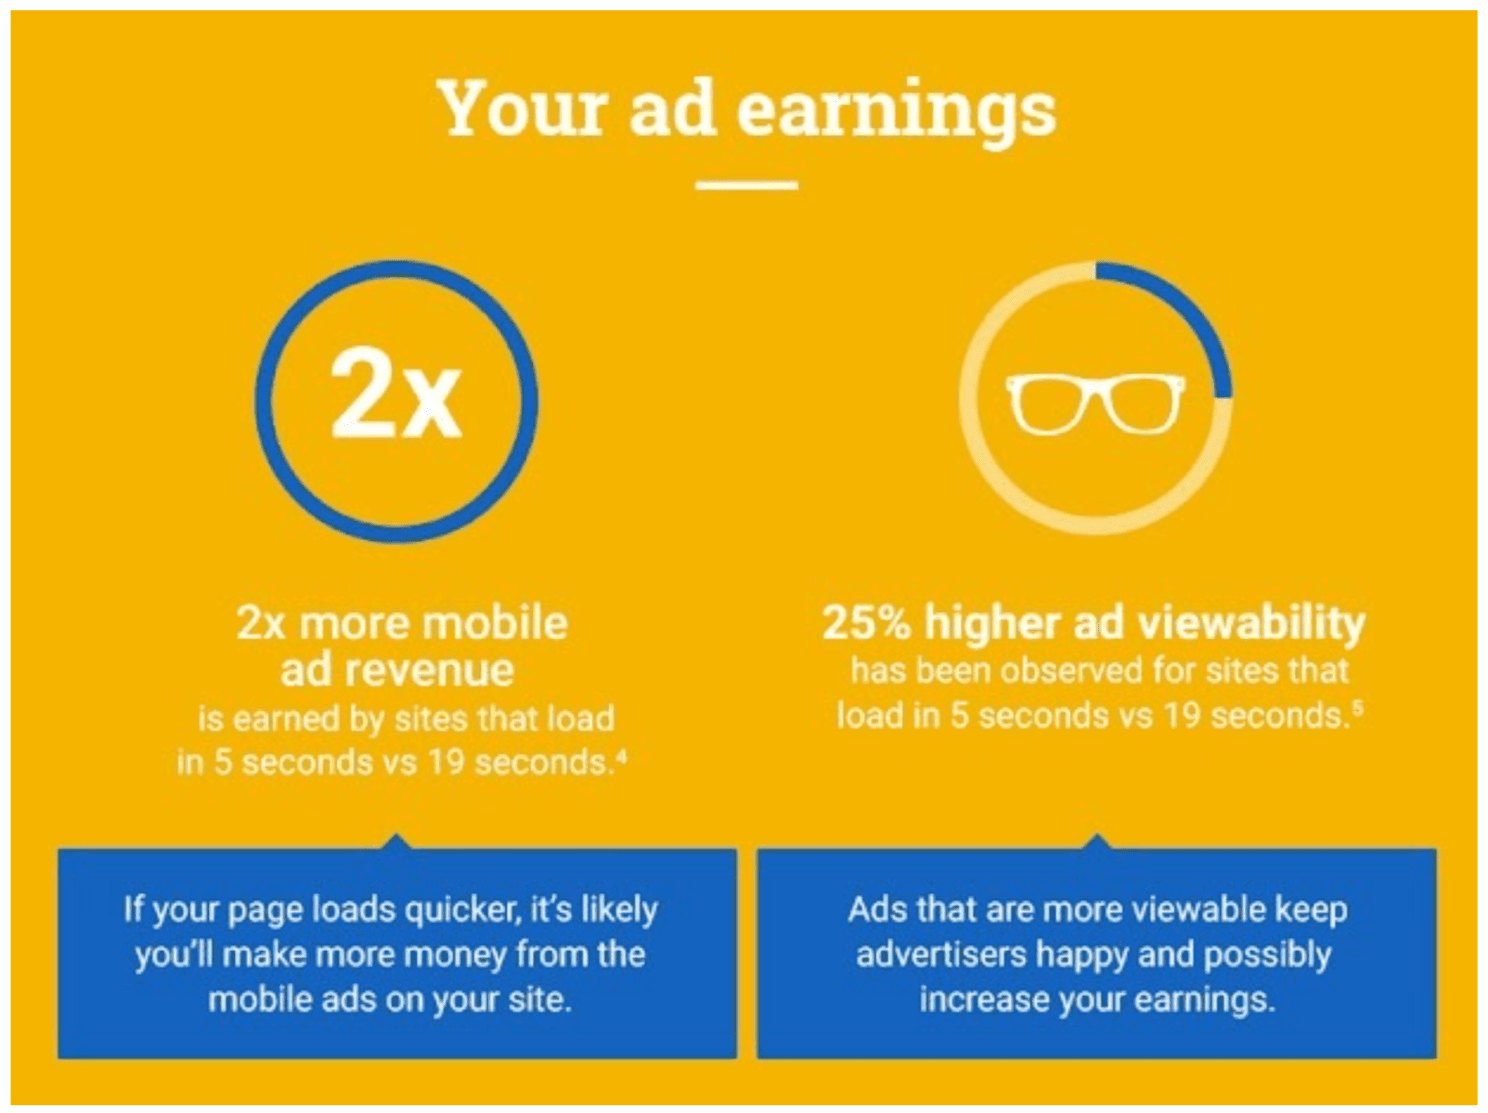
Research from Google has shown that mobile site ad revenues are dramatically affected by poor page speed:
5 KPIs for diagnosing page speed
There are a number of key performance indicators (KPIs) that fit under the umbrella of page speed analytics. You will be able to directly impact some of them. For others, you may be limited in what you can do. Focus on the following KPIs for a comprehensive analysis of your site speed.
First input delay (FID)
If you have buttons, links, etc. on your page, first input delay (FID) measures how long it takes for the browser to act when a user clicks on them.
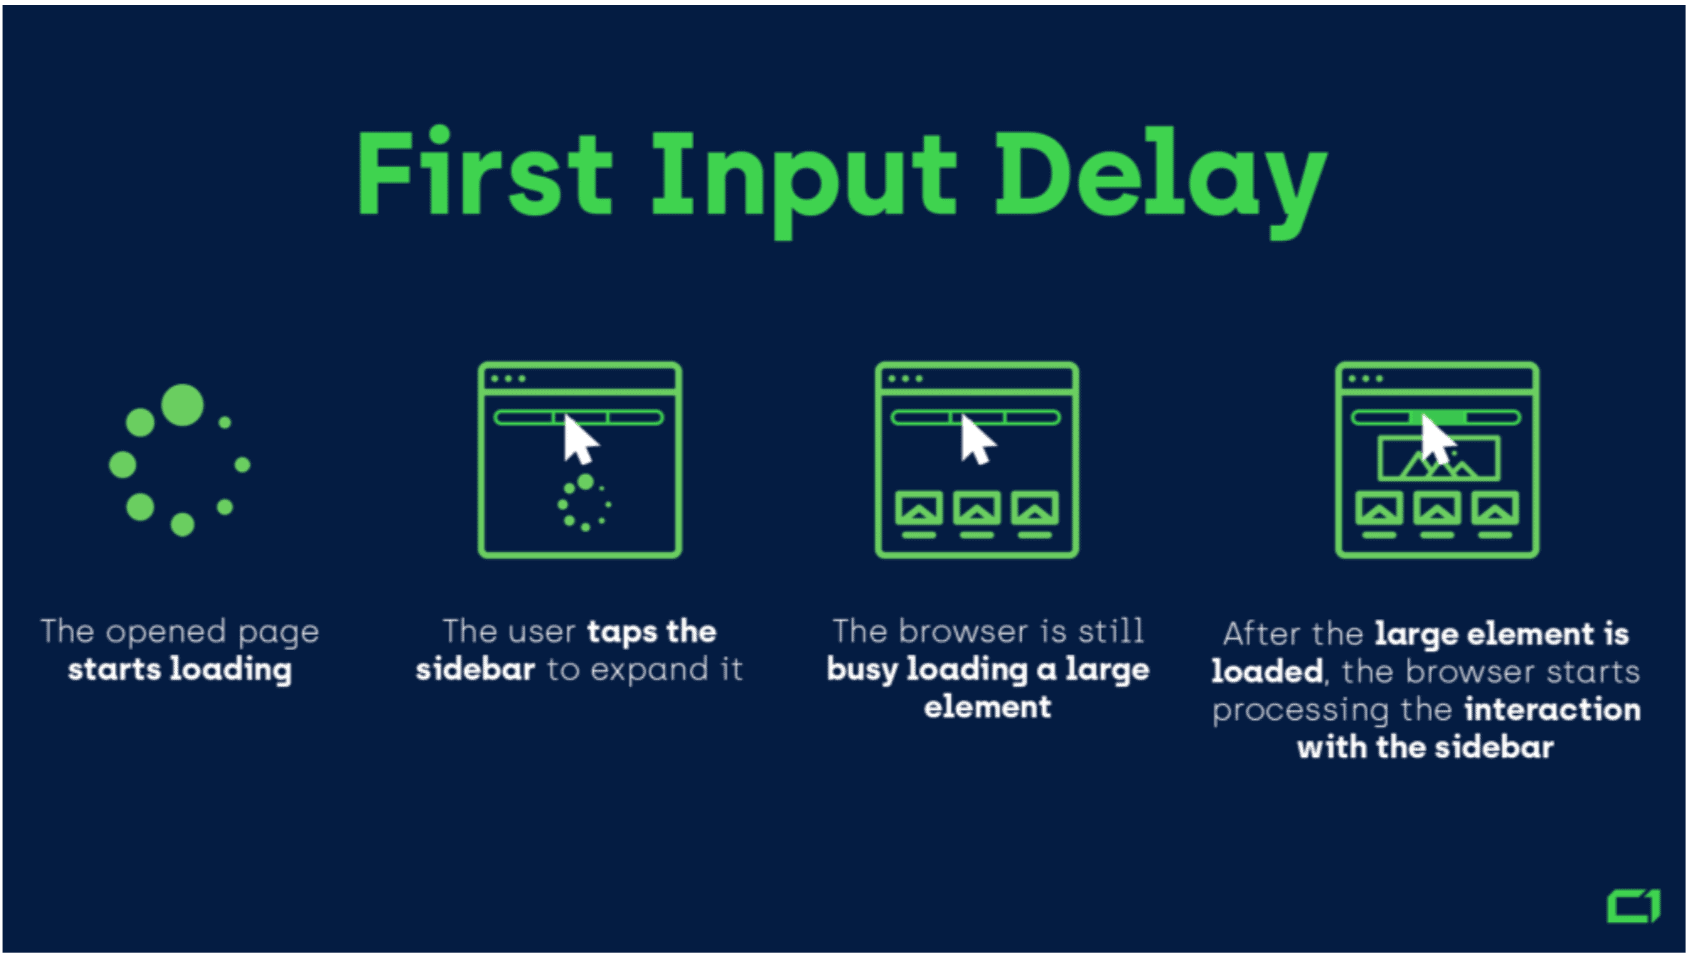
FID helps gauge the quality of users’ first impression of your content. The longer it takes users to access valuable resources on your site, the less likely they are to use them.
While this impacts the specific page’s overall performance, it may also impact the entire website’s SEO. When FID is long, users aren’t likely to visit as many internal pages than they would if interactive elements were responding faster.
First contentful paint (FCP)
This metric refers to the point at which any element of content shows up on a web page. It doesn’t have to be a certain amount of content. It could be anything as simple as a header, an image, or a button. The page simply has to have something on it so that it’s not blank.
Optimizing for first contentful paint has the potential to deliver the user with their desired content faster. Even if the first piece of content that appears on a page isn’t what the user is looking for, they’re more likely to wait for the page to fully load than they would if the page was entirely blank.
First meaningful paint
On the other hand is the first meaningful paint. It is the point at which your primary content first displays for the user. This metric holds a little bit more weight, as it denotes when the page becomes truly valuable to visitors.
First time to byte (FTTB)
Time to first byte, also known as “server response time,” is a measure of how long it takes the browser to receive the first piece of data from your web page. Google recommends that you aim for a FTTB of 200 milliseconds or less. Common issues that impact this metric include excessive web traffic (creating bottlenecks), improper server setup, and connectivity issues.
Time to interactive (TTI)
Interactive elements can greatly add to a website’s user engagement and overall performance. Time to interactive (TTI) is the amount of time it takes for the content to be functionally interactive for the user. A web page is considered interactive once it is:
- Reacting to user clicks and mouse movements
- Displaying valuable content
- Responding to user actions in 50ms or less

This is an important metric because it measures the functionality of a page, not just the visual content. If you have a lot of links, buttons, etc. in your content, pay close attention to TTI.
Assessing your page speed with Google Pagespeed Insights
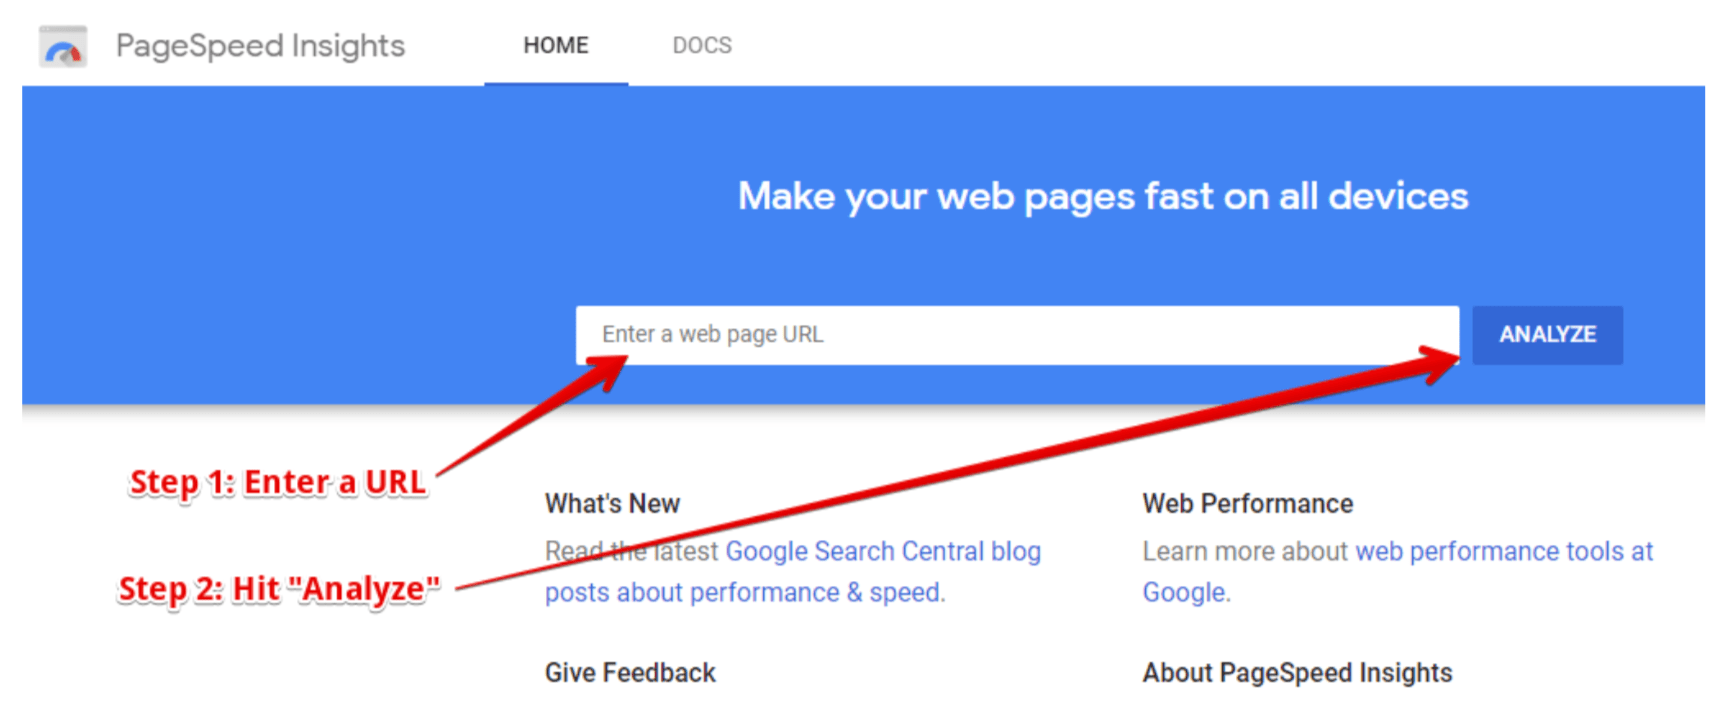
Google’s PageSpeed Insights tool analyzes desktop and mobile pages and gives recommendations on how to improve them. To use it, you first need to enter a web address and select the “Analyze” button:
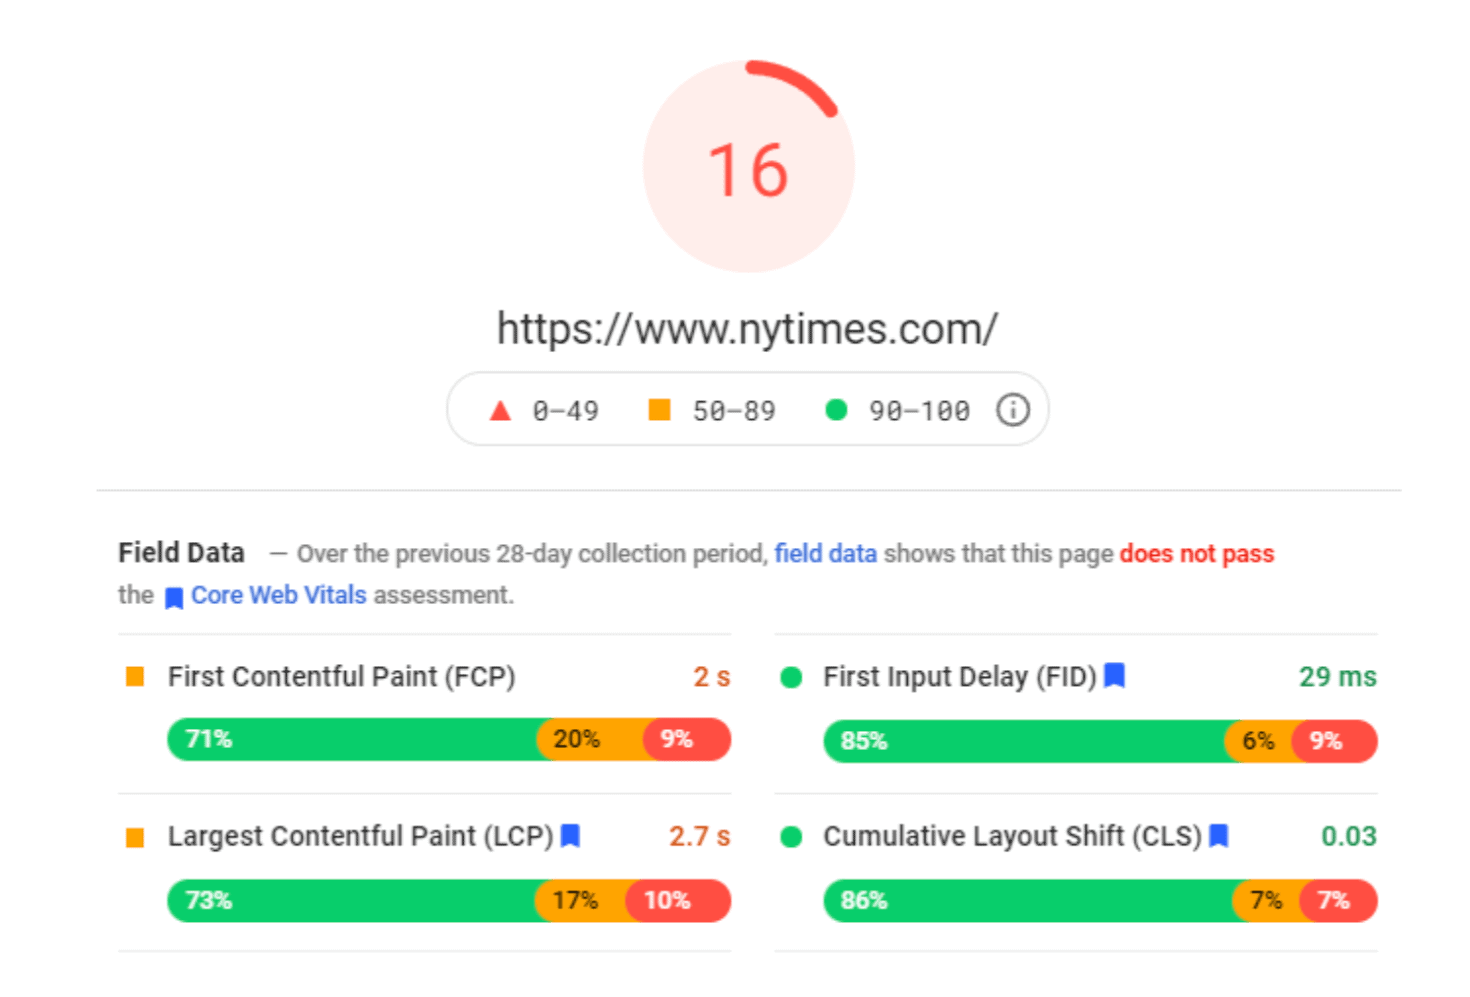
Then, the speed test will return a full report. It has details about your page speed KPIs:
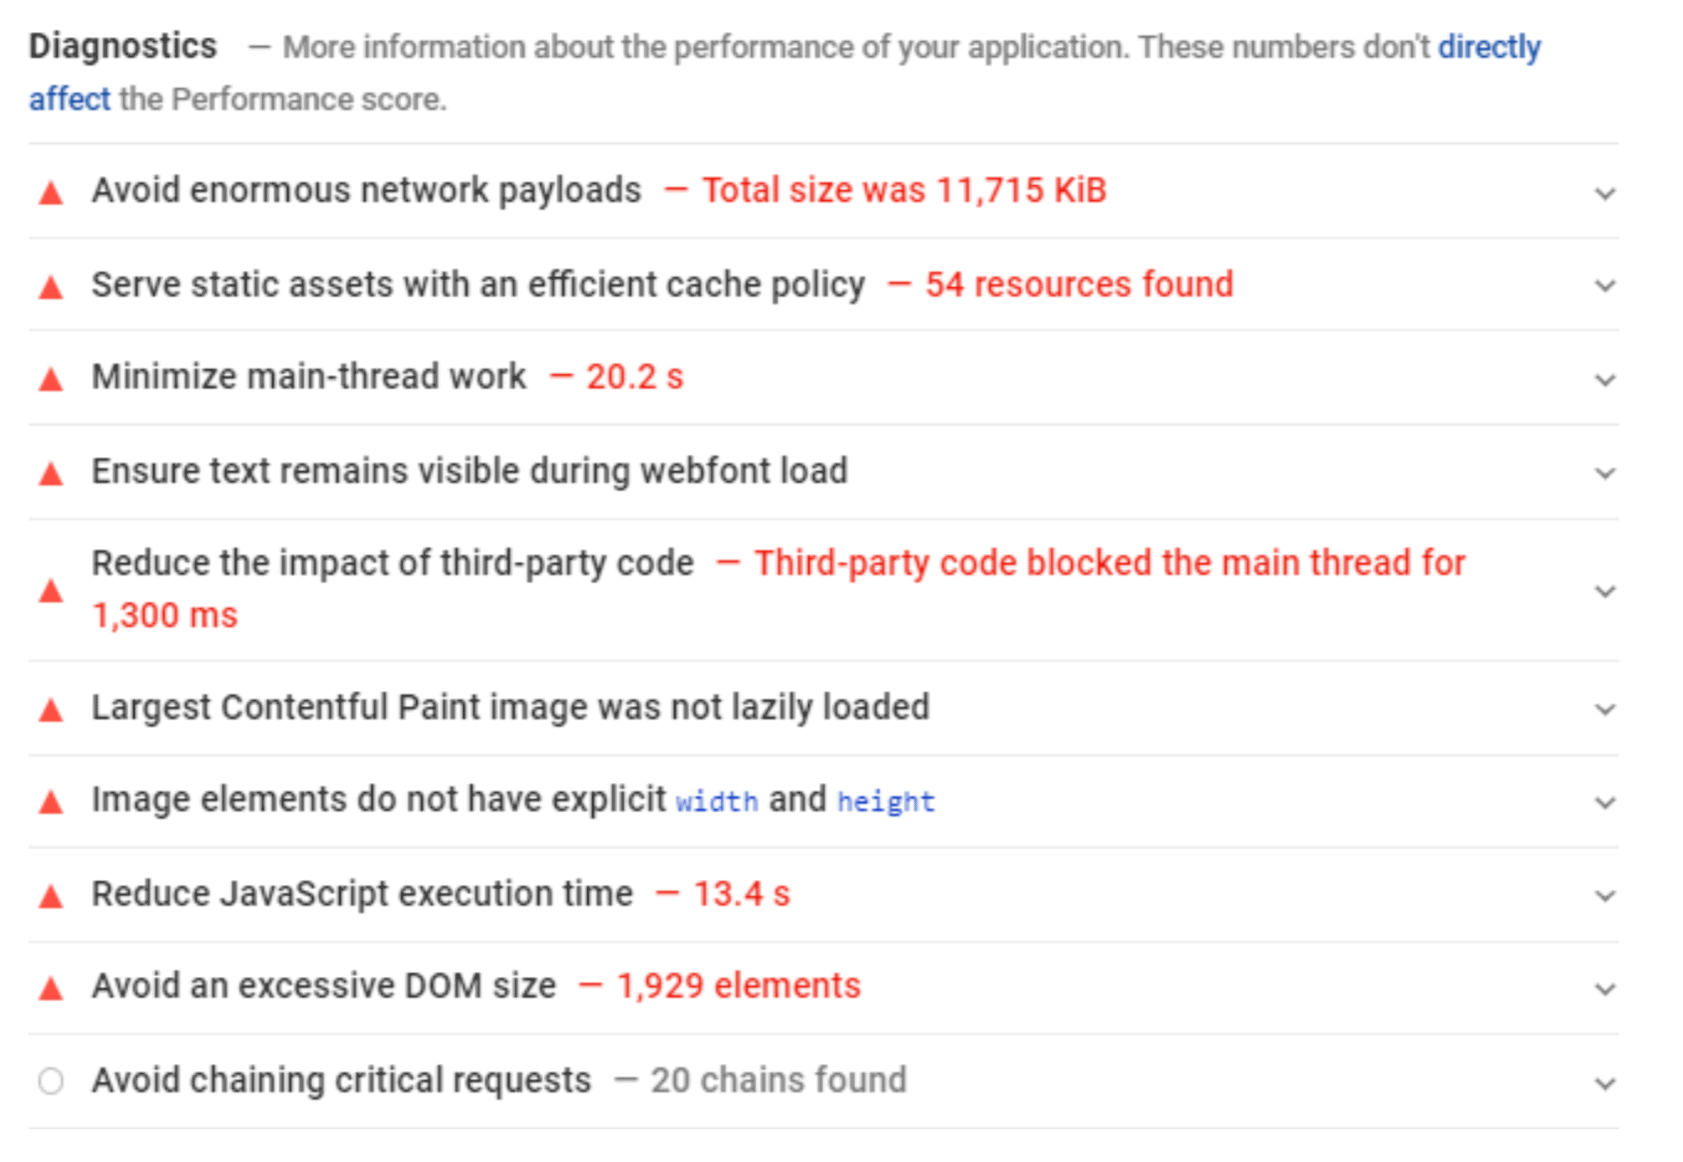
And the “Diagnostics” section tells you why certain elements have slowed down your page load speed:
The PageSpeed Insights API provides a performance score on a scale of 1-100. It is generated using Lighthouse, a free analysis tool that grades your overall web performance in areas like SEO and user accessibility.
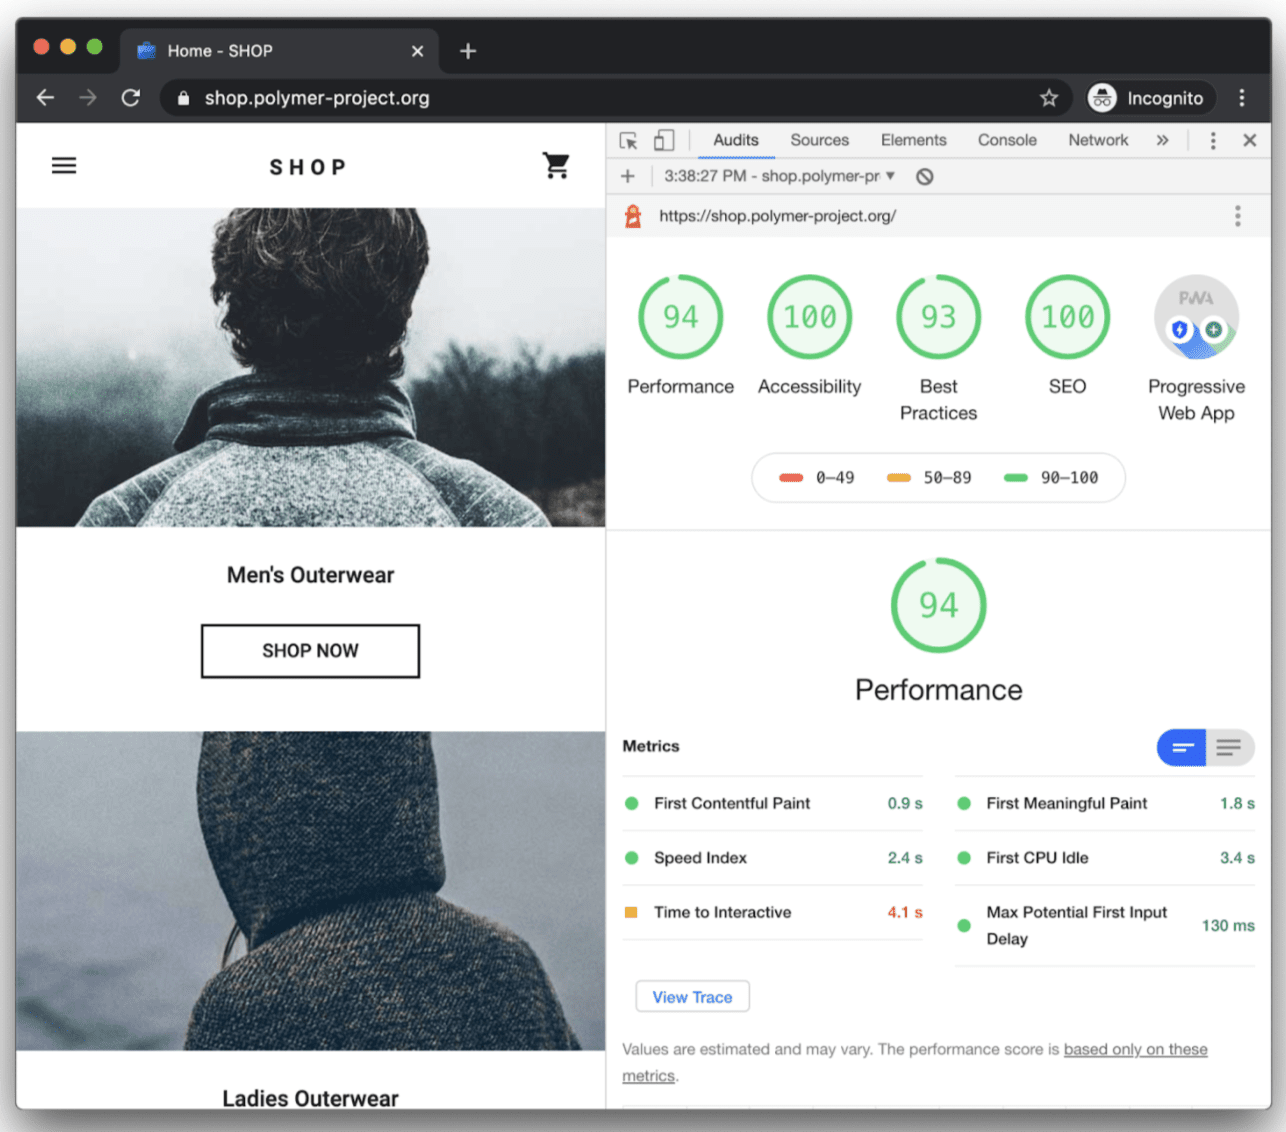
With this score, you can get a quick synopsis of your overall page speed health.
What is a good Pagespeed Insights score?
PageSpeed scores are divided into three main categories:
- Poor: 0-49
- Needs improvement: 50-89
- Good: 90-100
The goal is to score above 90, but it is possible to have a high-ranking website with a lower score. You can cross-reference your PageSpeed results with other tests like YSlow. Another option is GTmetrix, a website analysis tool that combines elements from multiple tests together.
While you should always strive for the highest score possible, remember that actual page speed, not your PageSpreed Insights score, is considered a ranking factor. If your site is fast and provides an exceptional user experience, you should see this reflected in your SEO metrics and rankings.
How to improve your Google Pagespeed Insights score
Many web developers use their PageSpeed score as a baseline for making site improvements. These are some of the most effective ways to boost your score and create a better user experience.
Use a CDN
A content delivery network (CDN) is a grouping of data servers placed in strategic geographic locations. It allows users to access data from nearby servers, reducing the wait time for viewing web content.
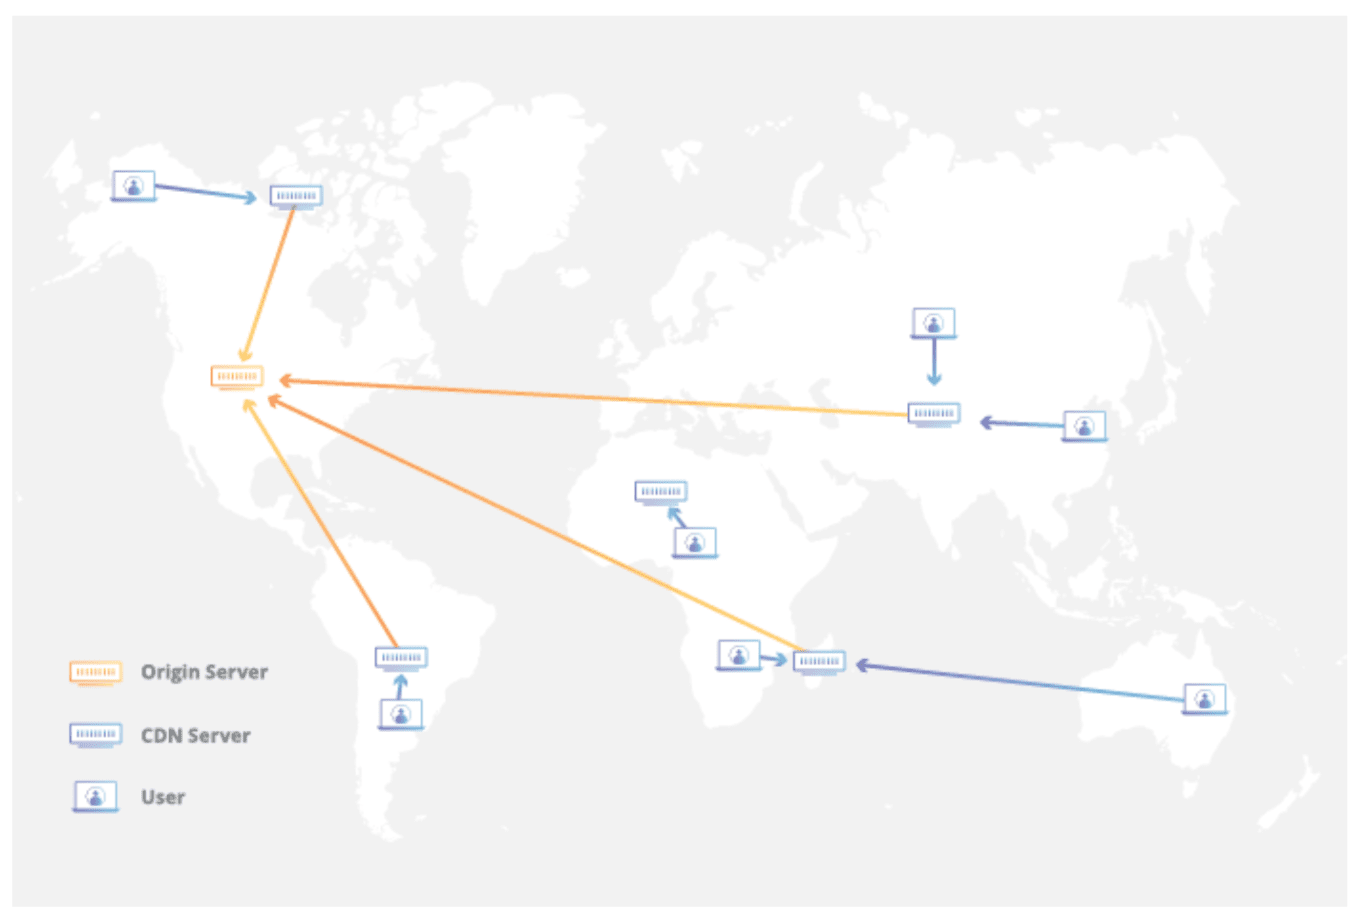
CDNs are designed to make web pages load faster and reduce bandwidth costs by storing (or caching) data in more optimal locations. But they also allow brands to handle larger traffic volumes and provide more data security to users. Using a CDN is an easy way to speed up the loading process.
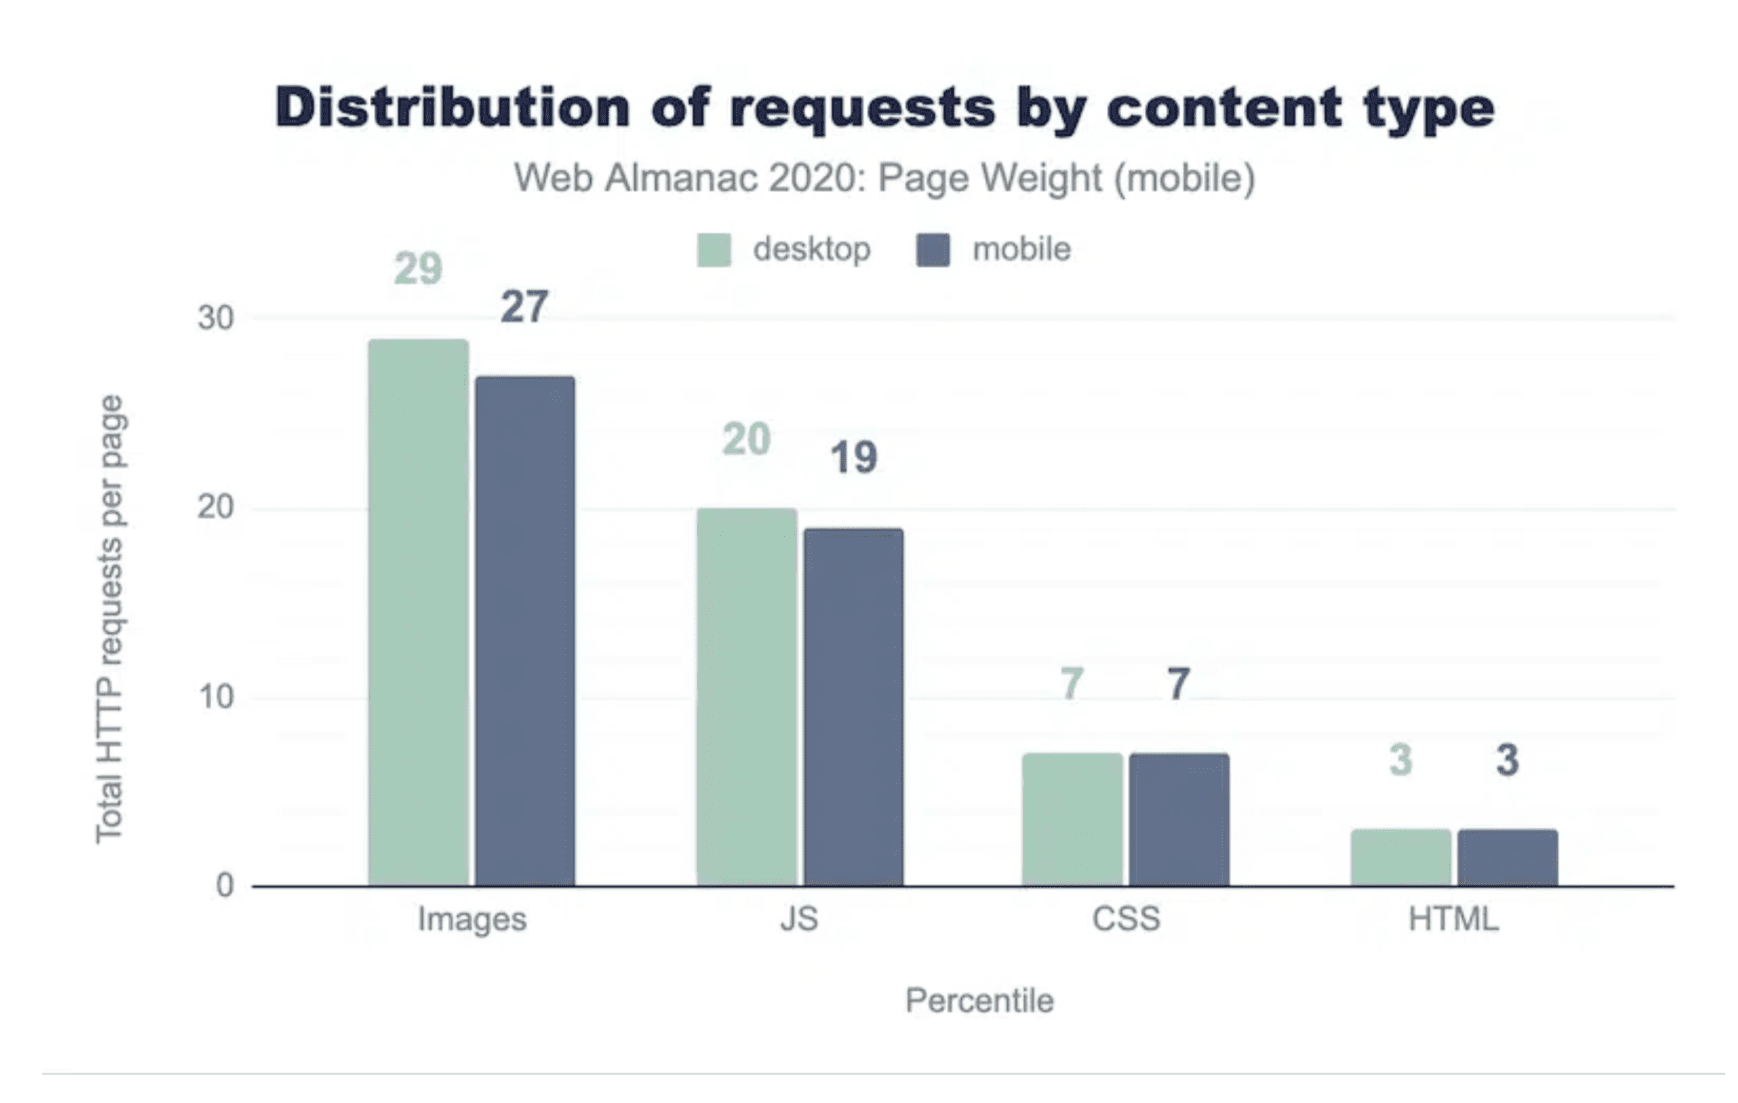
Optimize images
Images add significant value to a web page but they often take up a lot of space. When they’re a larger size, a high-quality file type, or there are a lot of them on a particular page, they can significantly slow down your loading speed. In fact, images account for the majority of all HTTP requests:
To reduce the impact that image files have on your page speed, make sure to do the following:
- Compress your images. Large images simply take up too much space. The optimal file size is 500KB or smaller. Using an image compressor will reduce the image’s file size while changing its dimensions (in pixels). TinyPNG is one of the most popular tools for compressing images. Most platforms like WordPress and Squarespace also have compression options that you can use.
- Pick the correct file type. PNG files are typically high-quality but bulkier. JPEG files, on the other hand, usually take up less space but may not be the right choice if image quality is crucial to understanding the image. Avoid .doc, .pdf, and .psd file types altogether. They won’t display properly on most browsers.
- Change the file name. Your image file name needs to include relevant keywords for better SEO performance. This gives search engine crawlers more context to understand the image. Simplify your files by eliminating special characters. This ensures that every site is able to interpret and properly load your files.
- Use lazy loading on your site. Speed up a web page by only loading the images and content on the screen in front of the user. Lazy loading puts less strain on the server to display images that haven’t yet been requested.

These techniques can have a major impact on your page loading time. Plus, you may find that some of your images are unnecessary. By deleting filler photos, you can speed up the page and make the content more valuable to users at the same time.
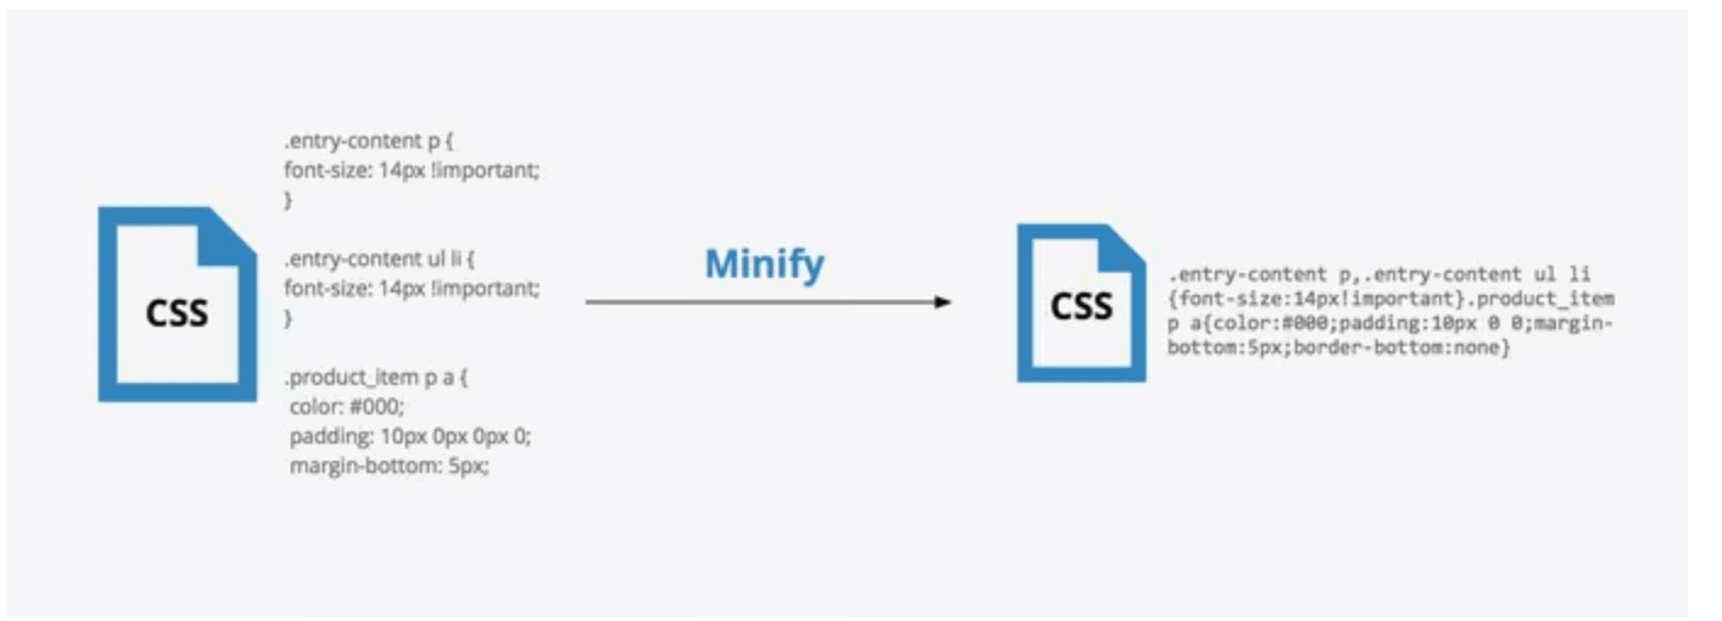
Minify JavaScript, HTML, CSS
The background data for your web pages also takes up a fair amount of space. You can decrease this impact by minifying your data. The process of minification involves paring down your code so only the essential information, variables, formatting, etc. remain.
There are many tools to minify your HTML, CSS, and Javascript files. Some of the most popular ones include:
This gets rid of redundancy in your data and can actually eliminate or consolidate certain files, meaning the browser doesn’t have to open as many files to render data for users.
Minimize redirects
If you’ve deleted or replaced an old piece of content with content on a new URL, it’s important to use a redirect. Redirects send users from an old URL to a new one. Redirects are very valuable for the most part, allowing you to move content to a new location while allowing users continued access through old URLs that may still be present on other websites, in other promotional materials.
Every redirect that you add to your content, however, interrupts the browser as it renders the web page. Redirect chains, which are made up of multiple URLs, can have a massive impact on your page speed.
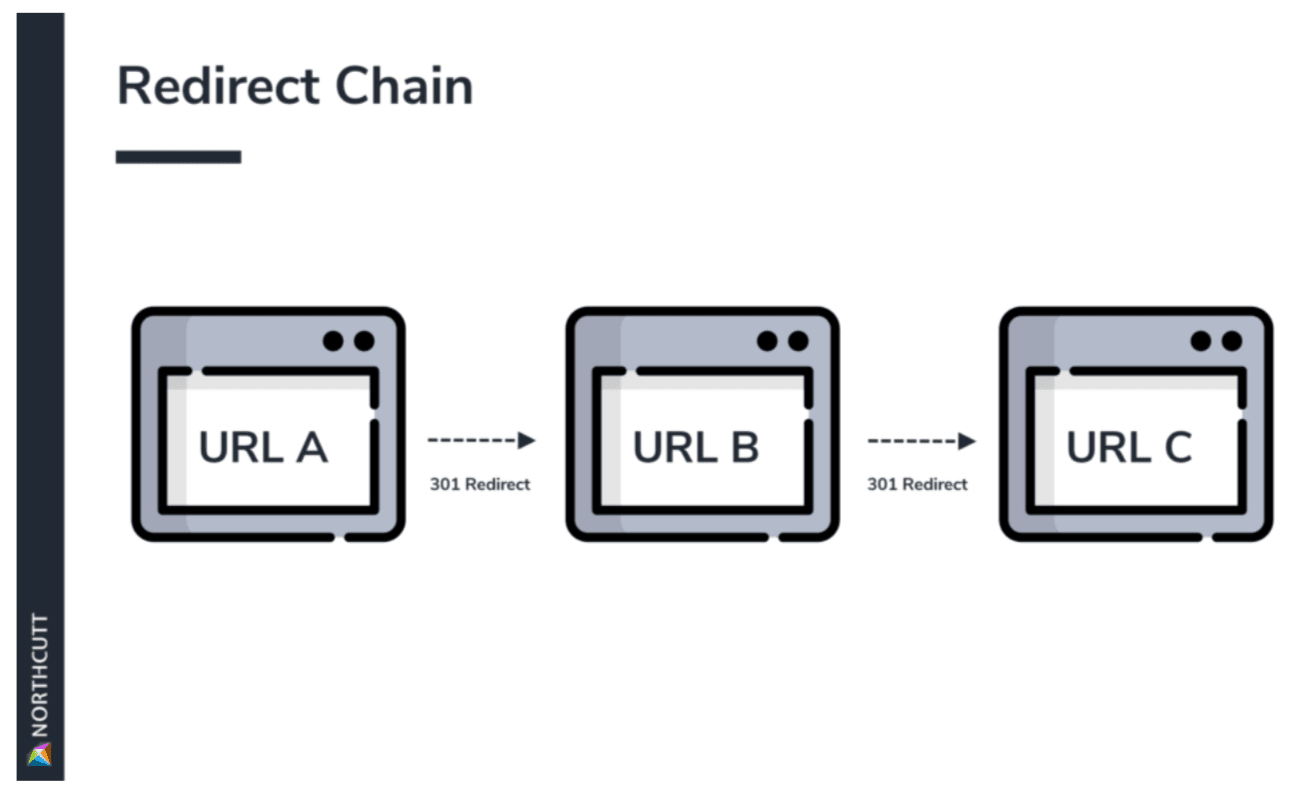
Instead of going from point A to point B, the user has to wait for the browser to make multiple stops on the way. This delays page load time, making for a poor user experience.
To fix this issue, minimize your redirects to eliminate unnecessary delays. You can find and analyze your redirect chains using tools like Sitebulb or Screaming Frog. Once you’ve found them, you can work to reduce the number of URLs in between users and their destination.
Use browser caching
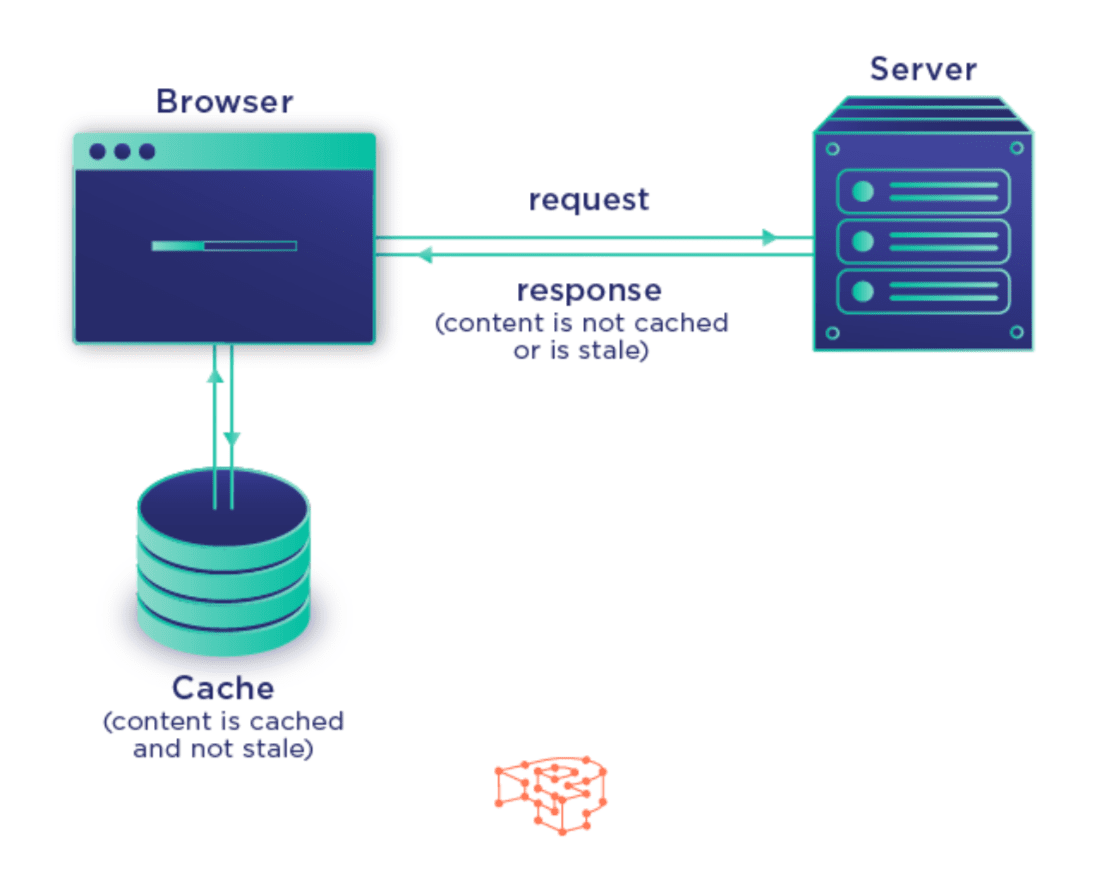
A cache is a digital storage location where web data is held for future use. When someone visits a website for the first time, a browser like Chrome has to pull all of the data to display the web page. But a lot of that data won’t change if the user visits the page again. That’s where browser caching comes in.
Browser caching is when browsers temporarily store website data so they don’t have to do as much work the next time a user visits a page. Instead of pulling all of the data from the website, the browser will simply retrieve it from the cache, a transaction that takes much less time.
You can set up browser caching by updating your .htaccess file or using a WordPress plugin like Hyper Cache. It’s an overall simple process that can dramatically increase your page speed.
Get a complimentary SEO audit
Despite having a direct impact on user experience, page speed isn’t a focus of many websites. Page speed optimization can boost sales, lower bounce rates, and create positive brand perception all at once. By monitoring speed analytics and implementing small but effective changes, you can drastically improve your content’s performance in search results.
Want to see how you’re doing with SEO? Get an instant SEO audit below. Or, schedule a free consultation to see how intent SEO can boost search traffic revenue by 700%.